Statistics
Interface
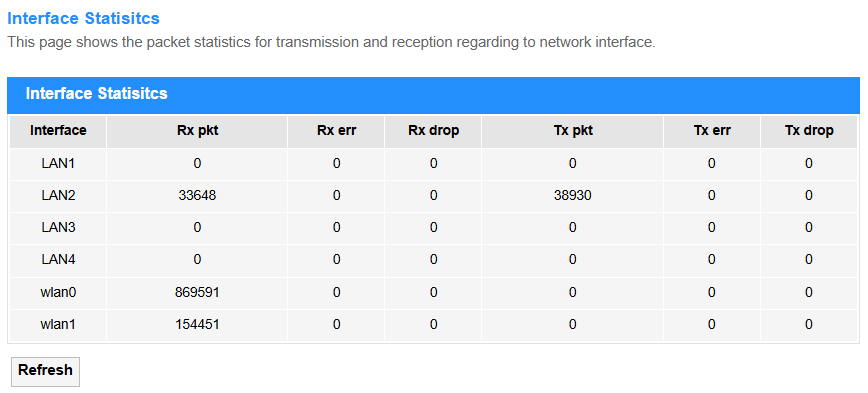
Interface Statistics monitors real-time traffic data (e.g., speed, packets, errors) on router interfaces (WAN/LAN) and thus help to troubleshoot network performance or congestion.
• Interface: The network port name (e.g., WAN/LAN) being monitored.
• Rx pkt: Total packets received (inbound traffic).
• Rx err: Corrupted/error packets received (CRC/alignment issues).
• Rx drop: Packets dropped due to buffer/bandwidth limits.
• Tx pkt: Total packets transmitted (outbound traffic).
• Tx err: Failed transmissions (collisions/queue errors).
• Tx drop: Packets discarded before sending (congestion/QoS rules).
• Refresh: Click to update the Interface Statistics.
PON_Statistics
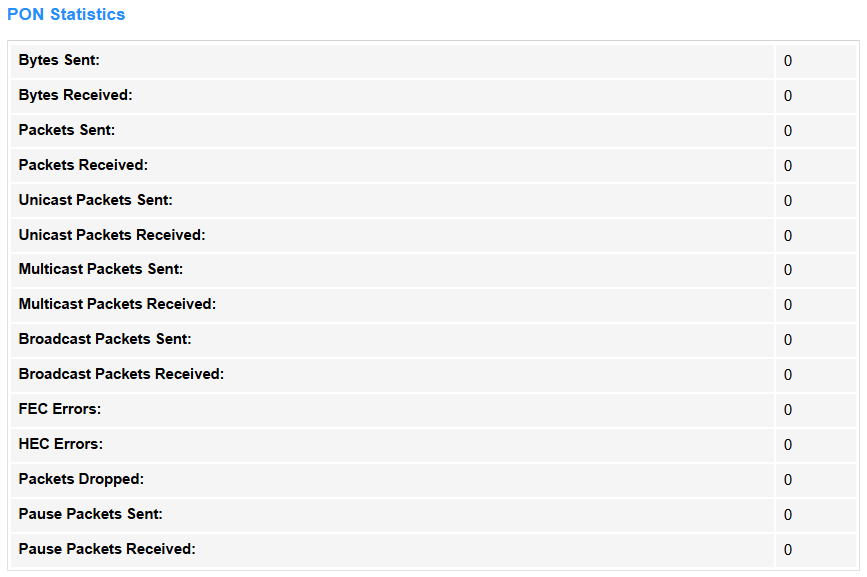
PON Statistics tracks optical signal metrics (e.g., power levels, uptime) for fiber connections (GPON/EPON), and thus to ensure stable ISP link quality. Only visible on fiber-optic routers with PON ports.
• Bytes Sent/Received: Total data volume (in bytes) sent or received over the PON interface.
• Packets Sent/Received: Count of all packets (including unicast/multicast/broadcast) sent or received.
• Unicast Packets Sent/Received: Point-to-point traffic (single destination) sent or received.
• Multicast Packets Sent/Received: Traffic sent to or received from a specific group of devices.
• Broadcast Packets Sent/Received: Traffic sent to or received from all devices in the network.
• FEC Errors: Forward Error Correction errors, indicating signal quality issues.
• HEC Errors: Header Error Control errors, indicating signal quality issues.
• Packets Dropped: Packets discarded due to congestion/buffer limits.
• Pause Packets Sent/Received: Flow control frames sent or received to temporarily halt data transmission during network congestion, preventing packet loss.